Data Dictionary: Technical Guide

In this post, I will cover the process that we use here at Koalatative to create and maintain a data dictionary. The ‘whats’ and ‘whys’ are covered by Co-Founder Ryan Thomas in his post ‘Make Your Life Easier with a Data Dictionary’ so we will only look at the ‘hows’ here.
We use the same Airtable base that handles the rest of our CRO program management (which you can also get for free). The data dictionary component consists of three main tabs - going left to right in the following order:
Metrics
Events
Parameters
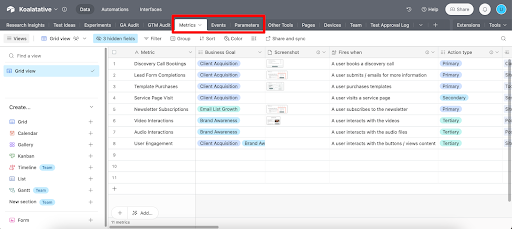
The ‘Other Tools’ tab is related to this process but only when we track the same metrics in tools like ad or AB testing platforms. It comes into play when there are other places where metrics need to have their own definitions and configurations, which might not be the case when you’re just starting out.
Now, each of these tabs has its own set of columns that need to be filled as we progress and we will look at them one by one:
1. Metrics
The Metrics tab is the primary user-facing part of the data dictionary. It’s a reference for both technical and non-technical users to be able to quickly see what is being tracked, in plain English. For the more technical (or just curious) people, this is the entry point where they can then follow the trail into the nitty gritty details of how the metrics are actually implemented, but the majority of team members will have no need to go any further than this.
This tab lays everything out in simple language that’s easily readable and understandable rather than technical, so everyone in the organization can look at it and get an idea of what is happening. The goal is to enable everyone to speak the same language and make it as quick as possible for new team members to get up to speed on the analytics setup.
We’ll walk you through this tab column by column. In total, there are 20, yes, twenty columns! But don’t be scared by that number, they all have a clear purpose and they flow quite naturally, which makes it easier after doing a couple of rows. These columns are:
Metric
Business Goal
Screenshot
Fires when
Action type
Primary Action
Is Rollup?
Rollup
Pages
Purpose
Additional info
Proposed GA4 event
Defining parameters
Additional parameters
Where to Find this?
GA4 Event
Other Tools
Other Tool Metrics
Test Ideas
Experiments
Let's look at each column in more detail:
1. Metric
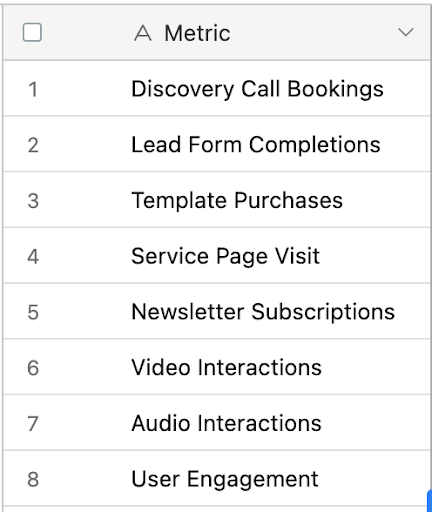
When we are going through the website, this is the column where we enter a name for each action that can be taken by a user that is important for the business’s success. These could be used to measure the performance of experiments or ad campaigns or for other types of analysis, for example how many users engage with a certain element - whether it’s a carousel, navigation menu, or video.
The name of each metric should be in layman's terms and descriptive enough so the user can easily understand what it means in the business context. ‘Discovery Call Bookings’ is a good example of a metric that is self-explanatory, whereas something more technical like ‘callBooked_41562’ or overly simplified like ‘Bookings’ doesn’t strike the right balance between descriptive and unambiguous.
Let’s look at a few examples of what could be some common metrics for e-commerce, B2B, and SaaS businesses.
In e-commerce, most businesses want to increase their purchases and average order value (AOV) but there could be others like cart adds, category / product page views, etc.
B2B is about getting leads (aka form submissions), booking meetings, or maybe just getting a prospect to view a solutions page. SaaS might be focused on free trials or demo bookings. These metrics could be further broken down e.g. form submissions could be the rollup goal but contact, demo, and other inquiry forms could be separate metrics on their own.
Once you have the core metrics that are pretty much used across the board for these business models, you can add more depending on what matters to you or is specific to your website and business.
Aside from key actions that the users takes that count as a business goal, you might want to track different indicators of engagement or progress like time spent on the page, clicking on certain tiles, interacting with sliders, CTA clicks, application/form steps, filter selections, account creations, etc. you get the idea of how customized it can be.
2. Business Goals
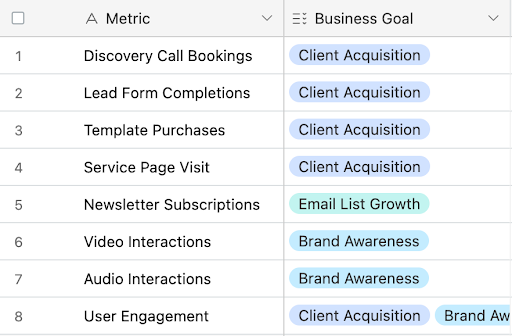
This is a multiple select field that you would ideally just set up once at the beginning of the process so that you can quickly select the goal for each metric as you go. A business goal is broader and bigger than a single metric. One metric could lead to more than one business goal and they will understandably differ for every business, though some of them might be a bit more universal.
For instance, it’s obvious that SaaS businesses want more paying users and ecom sites want more purchases but there are other business goals that are used internally as important KPIs which can be added here as well.
Whatever the actual goals might be, it’s important to tie your metrics and business goals together so there’s a sense of direction as to why this metric is important to measure.
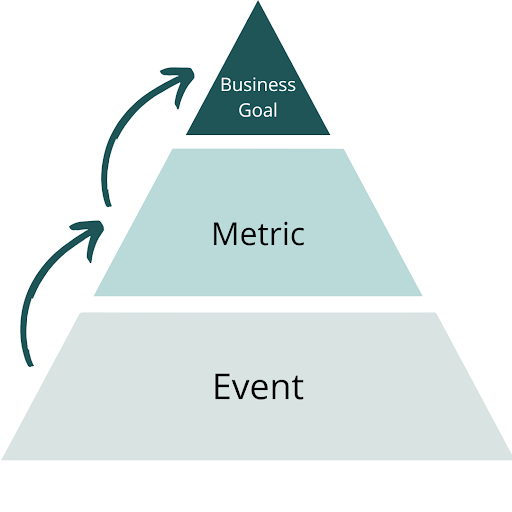
So, this hierarchy works in such a way that events sit at the bottom since they are the closest thing to physical reality. They represent the technical layer, whereas metrics are more conceptual as something that you want to measure, and business goals provide the purpose.
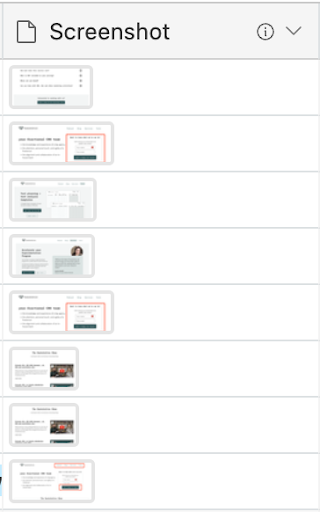
3. Screenshot
This one’s quite simple to understand, we simply add screenshots of where the mentioned metrics can be accomplished to act as a visual representation that is easy to compare to the live site.
It’s up to you how rich you want this column to be. Do you want screenshots of where users can take those actions or also screenshots of the next step after the desired action has been completed (for example a thank you page)?
We generally tend to go with the former because that’s where the real action unfolds. It’s pretty common for the event to only fire once the user reaches the confirmation step, but this is getting into more technical territory and we want this data dictionary to be focused on the action that the user needs to take.
4. Fires When
This column describes what needs to happen for the metric to be counted. The ‘Fires when’ terminology reflects the mental model of firing triggers for the underlying tags - but it could simply be ‘Triggers when’ or ‘Measure when’ - if you prefer.
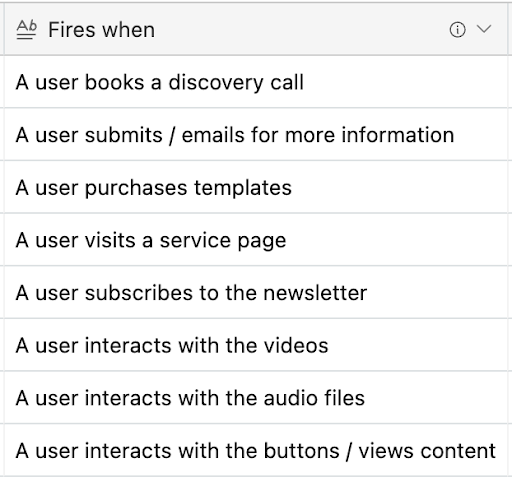
So, in a way, this is what the success of the corresponding metric looks like.
5. Action Type
Metrics can be further categorized into three action types, so we are finally here to discuss that column. The column has three action types:
Primary - This action leads directly to a business goal. In essence, these actions are why our website exists.
Secondary - A secondary action is one that the user has to take to progress towards a primary action.
Tertiary - Any action that measures user engagement or something that isn’t directly related to a primary metric.
Each one of them acts like a building block of a pyramid where the business goal always sits at the top but each one of them is also useful on its own.
So, if the goal is to have lead form completions then visitors reaching a lead page could be a metric which is a secondary action that leads to primary action because if someone visits the lead page only then can they complete a lead form.
The third type of metric here could be something like ‘Video Started’ which is important, and could be an indicator of intent, but doesn’t necessarily lead to a primary metric.
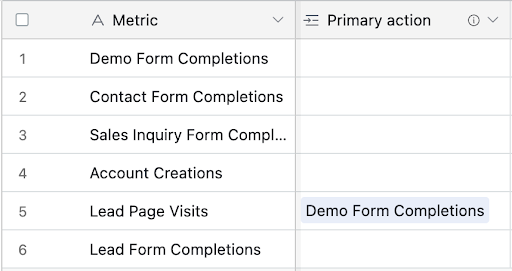
6. Primary Action
This refers to the ‘Action Type’ we covered in point 5 but only the primary action. It provides visibility into what primary action a metric leads to (if any), by linking to that record within the same table. For instance, Lead Page Visits lead to the primary action of Lead Form Completions (or any other primary action for that matter) but some metrics are primary actions themselves e.g. Lead, Demo, and Contact Form Completions don’t complete any other primary action.
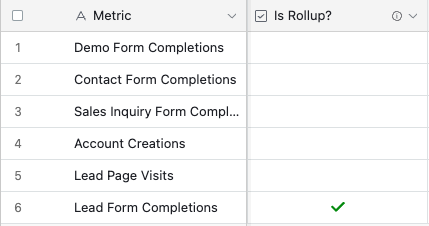
7. Is Rollup?
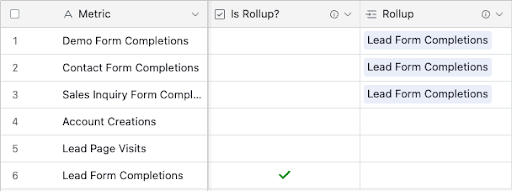
This column is a simple check whether the metric we have is a roll-up of two or more other metrics. For instance, metrics like Demo Form Completions, Contact Form Completions, and Sales Inquiry Form Completions can be rolled up into another metric called ‘Lead Form Completions’.
This is so we can analyze multiple metrics in a group if needed. So, in front of the ‘Lead Form Completions’ metric, this column will be checked since it’s a roll-up of the other three and potentially any other lead forms that are added later on.
8. Rollup
This one continues the story from the ‘Is Rollup?’ and simply links to the metric that is used to roll up a specific metric.
For instance, Demo Form Completions, Contact Form Completions, and Sales Inquiry Form Completions are rolled up into Lead Form Completions metric, so we will mention that in front of these metrics.
This gives us clarity on whether the metric is only tracked individually or as part of another rollup metric. This is what the column would look like then:
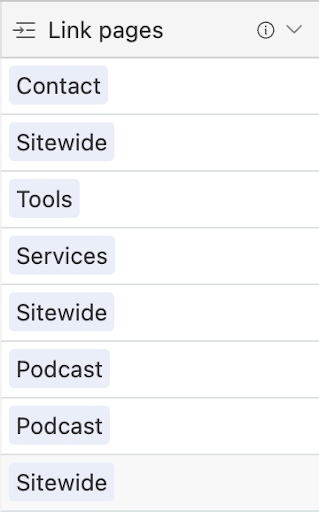
9. Pages
This column is linked to another tab called ‘Pages’ where we list the page names and their URLs. So, these are the pages where the users can take the action that’s mentioned as a metric.
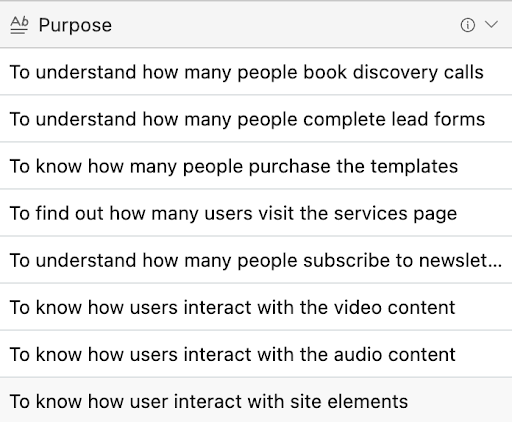
10. Purpose
In this column, we clarify why we want to measure a metric in simple words. This is the whole purpose of measuring it.
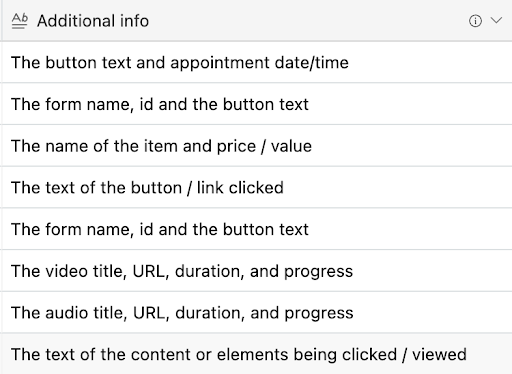
11. Additional info
Here we want to simply mention what other details we want to collect apart from the main metric / action.
This additional info forms the basis of parameters that we will collect with the events later on.
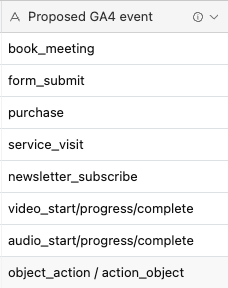
12. Proposed GA4 event
Before we go any further, it’s important to note that while it mentions ‘GA4’ - the data dictionary is tool agnostic and this could be easily renamed to whatever tool you are using. We go with GA4 as default because that’s the most popular one even with all its faults, but most popular analytics platforms have a similar event / parameter based model and this approach will work with them just as well.
So in this column, we simply write down the event names that we would like to send to GA4. These names are not final, they can change later on - as the title says ‘proposed’.
Keeping in line with some best practices, our naming conventions follow what the vendor generally recommends.
For instance, GA4 has certain event naming rules that should be followed. It also has a list of Enhanced Measurement events that can be used if we have not enabled them. These events are collected automatically by GA4 when Enhanced Measurement is enabled from GA4’s settings, but if it’s not we can use those event names and associated parameters ourselves.
It makes our lives easier because we can map to existing names and parameters Google provides. The parameters are also available to be used by default in Explorations (except User explorer) but to use them in reports and User explorer exploration, we have to add them as custom definitions.
Apart from that, Google also has a list of ‘Recommended events’ that can cover a lot of ground before we have to move on to custom events.
For custom events, we follow the rule of object_action or action_object. We are not entirely set on one of them because even Google changes the rule e.g. form_submit (object_action) and generate_lead (action_object).
So as long as it’s either of them and communicates what it is then we are fine.
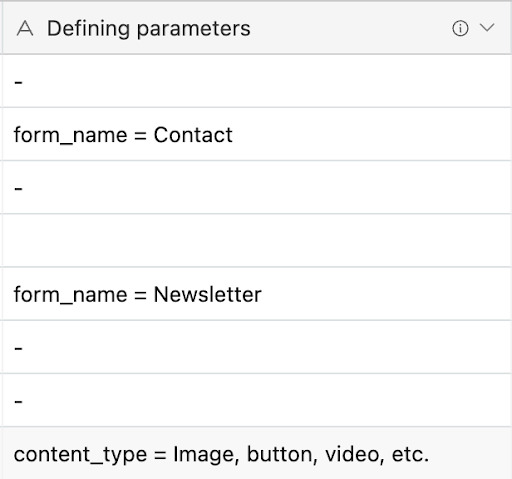
13. Defining Parameters
This is for the parameter name and value that actually defines the metric. In many cases, it makes sense to reuse event names for multiple purposes and use parameters to differentiate between different versions of that event.
Still a little confusing? Let’s say we are using the generate_lead event to track the Demo Requests, Contact Form Completions, and Landing Page Leads metrics.
The form_name parameter can differentiate where the lead is coming from based on its value, e.g. form_name = Landing Page or form_name = Contact, etc.
So, you see we still have one event to track multiple metrics using the same parameter but the different values of this parameter define which metric it corresponds to.
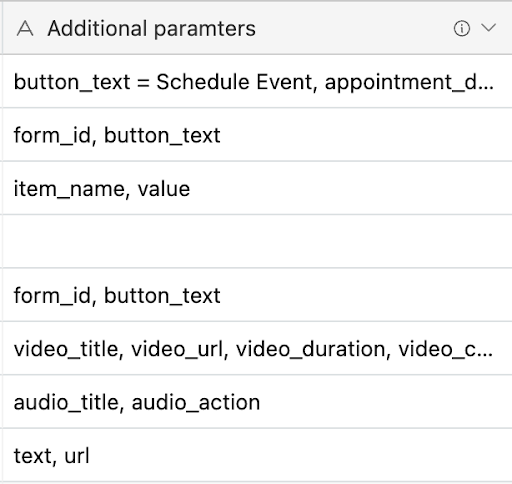
14. Additional parameters
Non-defining parameters that are collected with the events can be added in this column e.g. button_text, link_url, etc. It is not to say that these parameters cannot be used as defining ones for certain metrics.
The automatically collected parameters like page location, page title, and page referrer are not shown here because they are collected with all the events regardless but they will make an appearance later in the ‘Parameters’ tab.
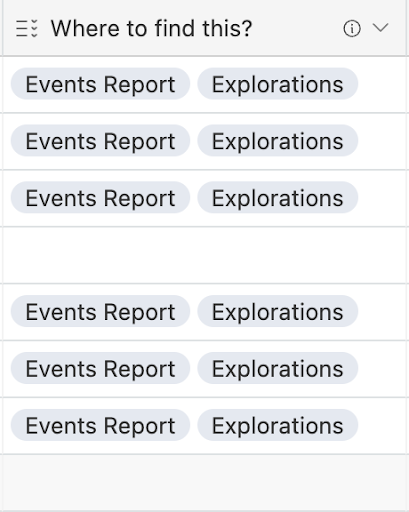
15. Where to find this?
This column simply points to the reports in GA4 (or any other analytical tools you’re using) where you can find all these metrics and their corresponding events.
When starting out we keep it simple: you can find it in the Events report and Explorations. Now, the latter is a bit generic because explorations have to be customized, so the values for all the rows are mostly the same until you build out any custom reports that can be linked here.
This doesn’t have to be limited to the analytics tool, we can also add links to any dashboards. The idea is that anyone who isn’t a frequent user of these tools can quickly find data on these metrics.
The next 5 columns are all linked to other tables in Airtable, so they don’t have to be filled in just yet but if you do they will be populated in other tables.
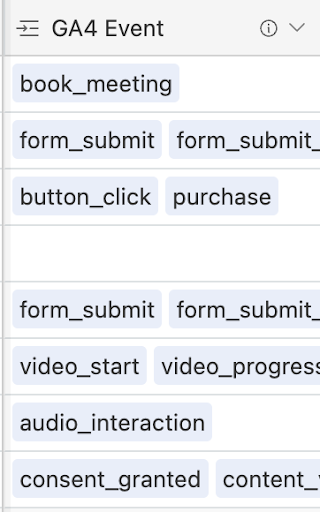
16. GA4 Event
Remember how we discussed the proposed GA4 event column? Well, this is where that proposed event is crystallized by being implemented and it doesn’t have to match the name as in the proposed GA4 event column because that was ‘proposed’ - not final.
This is also where the Events tab comes into play since this is where the actual events live. The GA4 Event column in the Metrics tab just links to the records there.
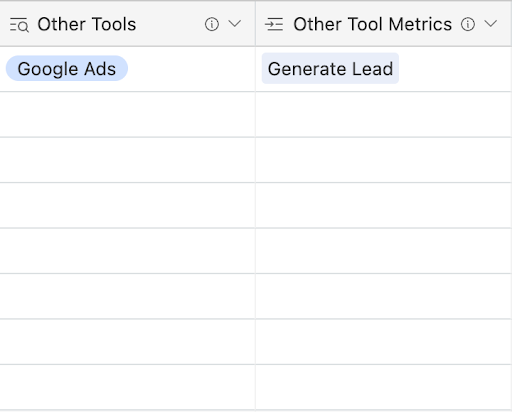
17. Other Tools
We mentioned this one at the beginning of this article as well where we could be using the same metrics in other tools, not just the analytics tool. These could be your email marketing, ad platforms (Google, Meta, etc.), and AB testing tools for instance.
By linking these metrics to other tools we now have a whole map of where that metric is being measured. This column is a lookup table that looks for the tool and its corresponding metric which is what the next column is about.

18. Other Tool Metrics
The same metric could be measured in other tools but it could be named differently. It links to the metric for the tool based on how it’s entered in the ‘Other Tools’ tab.
19. Test Ideas
This links to the ‘Test Ideas’ tab and it’s an important one because now the metric is being put to use for the test ideas.
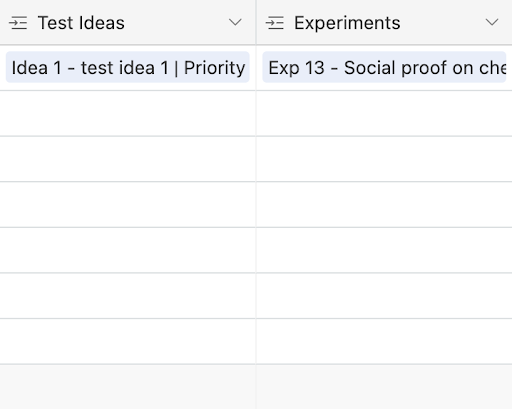
20. Experiments
Any test ideas that evolve into an actual experiment are in this table. The metrics are linked to experiments because they are used to measure the performance of those experiments.
And this marks the end of what goes in the Metrics tab and more importantly ‘how’. We’ll now look into the ‘Events’ tab where things get a little technical depending on your experience with tracking and analytics tools.
2. Events
In the events tab, there are 11 columns out of which 3 are linked to other tables. This tab is all about translating the metrics into events that can be implemented with a tagging tool like Google Tag Manager and how it all goes into the analytics tool like GA4.
Here’s a quick sneak peek at it:
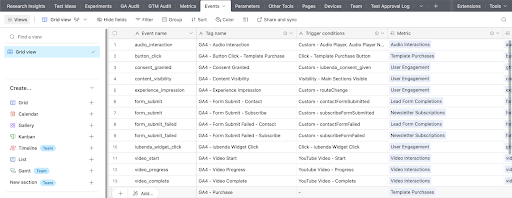
Let’s quickly look at what each column does.
Event name - The final name of the event as it will be sent to the analytics tool, which can be different from the proposed event name in the Metrics tab.
Tag name - This is the name of the tag as it is in the tag management system like GTM.
Trigger conditions - Here we simply mention the triggers used in the TMS for the event to fire. They can change after QA if there are issues with the existing trigger or when there are changes in how the event should be tracked, so it’s an easy one to miss when it comes to updating.
Metric - This is a linked column where the event is linked to a metric. An event can be linked to multiple metrics or multiple events can be linked to one metric.
Parameters - These are the actual parameters being sent with the event to the analytics tool. Parameters are derived from the Defining Parameters and Additional Parameters columns in the Metrics tab. Automatically collected parameters i.e. Page title, Page location, Page referrer, and custom parameter; gtm_tag are not shown here but they are added with every event even if there are no other parameters being sent.
Notes - This is a text field where you can mention something specific about the event or how the tag is set up in GTM - any info that can be helpful.
GTM Container ID - This lists the GTM container where the tags are set up which can be quite helpful if different containers are used for different parts of the website or business.
GA4 Measurement ID - The GA4 data stream to which the event is being sent to. This could be renamed to any other tool’s ID, not just GA4.
Assignee - The person who implemented the tracking so you can contact them if there’s any need or get more information from their colleagues if they have left the organization.
Status - There are three types i.e. Proposed, Implemented, and Verified to help keep track of the implementation.
Others Tools - This is a linked table that shows if the same event is also being used in any other tools e.g. Google Ads can import GA4 conversions.
Great, so that’s our Events tab done! Let’s move on to the final tab which is ‘Parameters’.
3. Parameters
Parameters exist to carry additional information for the events.
For instance, the generate_lead event on its own communicates an action that happened but the URL of the page, title, page referrer, button text, URL of the button clicked, form name, etc. are information that provides additional context.
In GA4 there is a quota on how many of these parameters can be used in a property based on their scopes (event, user, and item), and their types (dimension, metric, and calculated metric).
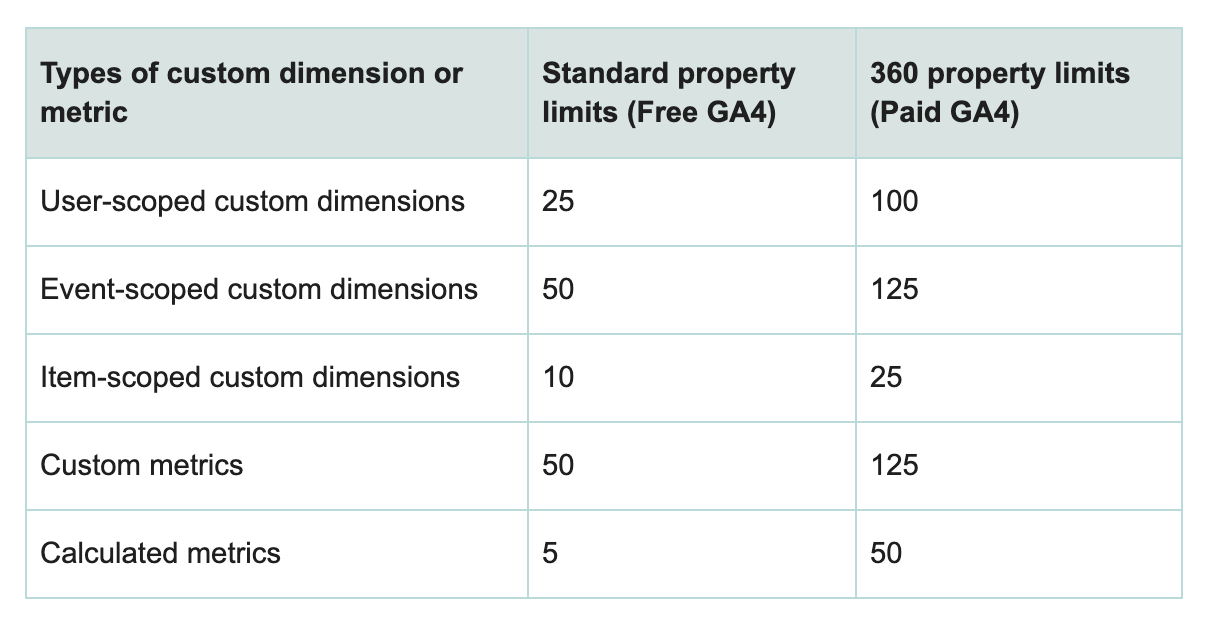
Due to such limitations, it makes sense to use the available quota wisely, therefore, where possible we should be naming our parameters in such a way that they can be used for multiple events e.g. type vs submission_type.
This is what Google also tries to show with its recommended events and their parameters and we designed this tab keeping that in mind. Here’s what it looks like:
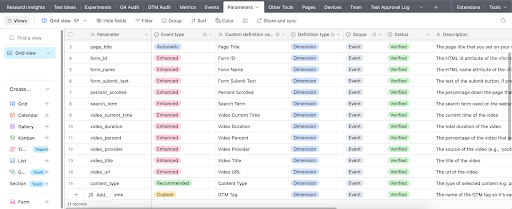
You know the drill we are now going to look at each column below:
Parameter - The name of the parameter. Ideally, we use the similar logic that we use for events i.e. object_action or action_object but it doesn’t always have to be the case, especially if it’s not a dimension or if the values could be boolean (true/false) or integers. What’s important is to use snake_case where applicable for consistency.
Event type - Okay, if we are talking about parameters then why is there a column saying ‘Event type’? Well, Google has some parameters that it collects automatically so they are associated with all events, others are collected with its Enhanced Measurements events that are controlled through the GA4 admin interface, and finally, it has a category of recommended events and their parameters. Anything that doesn’t fall into any of these three categories is categorized as ‘Custom’. The idea is to use all of these parameter names first and then go the custom pathway which is why the tab contains all those parameters ready to be used.
Custom definition name - All of these parameters have to be registered as a custom definition in GA4 to be used across the reports. So, this is the name that will be shown and this is where the above-mentioned quota is used. You don’t have to follow the snake_case naming convention here - it needs to be short and easily understandable.
Definition type - So we mentioned how these parameters can be a dimension, metric, user, and item scoped. This column handles that part of the parameters. It’s important to choose the right type of scope so you see the relevant data in the reports.
Status - This follows the same format as the one in the Events tab i.e. Proposed, Implemented, and Verified.
Description - A short and sweet description of the dimension, especially if its name is not very clear about what it does. This can be added in GA4’s custom definitions section so everyone who looks at the account understands what the definition does.
GA4 Measurement ID - The GA4 data stream where the parameter is registered as a custom definition which can be quite handy if there are multiple properties.
Event - This is a linked column to the Events tab where it shows with what events this parameter is being collected.
And with this, our exploration of all three tabs comes to an end.
Conclusion
The process of creating and maintaining a data dictionary is not linear, it’s a continuous process that we internally call ‘The Data Dictionary Cycle’ as seen below:
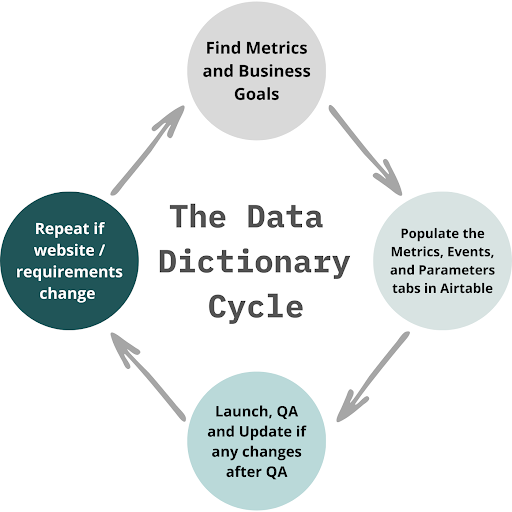
This means we shouldn’t just create it and leave it to the annals of history but rather maintain it by constantly reviewing and updating it - whether that’s done whenever there’s a change, monthly or quarterly is up to you and depends on the volume of any new changes.
Now, if you don’t have such documentation then starting today is better than tomorrow (or never). The important thing to remember is that it is tool agnostic and can be adapted to other tools and that there should be a resource dedicated to updating and maintaining your data dictionary otherwise all the hard work today will lose most of its value in 6 months to a year.
As Ryan’s post says, make your life easier with a dictionary! I’ll just add to it by saying that it's not just yours but the lives of everyone who has to work on implementation projects as well as analyze / understand what’s being tracked in the analytics tool and why, especially the juniors and new people who will join your company!
Happy tracking!
Want to know what we're up to?
We'll send you an email when we publish new content