Useful GA4 Reports for CROs

If you want to get the most out of your conversion rate optimization (CRO) program then using analytical data is imperative and this is why you need GA4.
Now GA4 can be somewhat difficult to navigate compared to its previous version Universal Analytics which has more intuitive default reports to get you started.
But don't let that discourage you; with a bit of effort, GA4 can provide even more valuable insights into how users interact with your website and which areas need improvement to increase conversions.
In this article, we'll show you the essential reports for CRO in GA4 and guide you through how to use them to improve your website's conversion rate.
From understanding user behavior to optimizing your landing pages, we'll help you make sense of the data and make informed decisions. So, let’s dive into it and see how can up your CRO game!
Pages and Screens (Engagement Reports)
In the built-in GA4 Reports section the Pages and Screens report is equivalent to the All Pages report we’re familiar with in UA and gives us a good idea about the traffic and other metrics to measure the pages you would like to test.
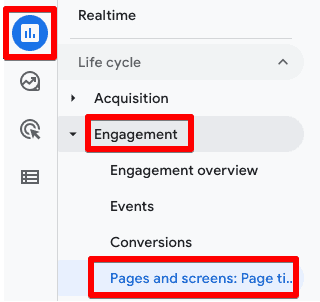
The important metrics to look at would be views, conversions, and of course total revenue (if configured).
You can also click the pencil icon on the top right to customize the report and add more metrics like Engagement Rate, Bounce Rate, and so on. You can also Save it as a new report and customize it further without changing things in the standard reports.
Organic Traffic and Queries (Search Console Reports)
Organic data is super important as these are people with high intent who come to your website when they are actively looking for something.
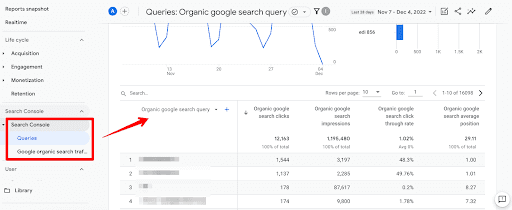
Linking your Search Console with GA4 will help you to see the two reports: Google organic search traffic: Landing page + query string and Queries.
These two reports can give you extensive data on your website’s organic performance and help you draw insights as to which Queries lead people to your website and which pages received the most organic traffic as well as how they perform on other important metrics.
Landing Page (Acquisition Reports)
Landing pages often burn a lot of ad money to get traffic so it makes sense that you should be able to measure and optimize their performance.
If a major chunk of your audience is coming from Paid Search then they are often high intent, because they are actively searching for what you’re offering and need some final nudges to convert. This is where your landing page can make a difference.
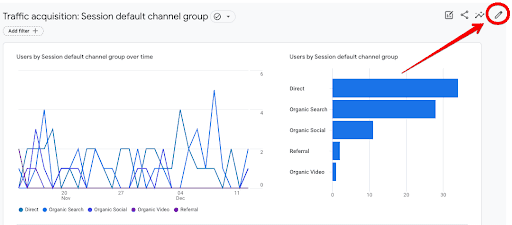
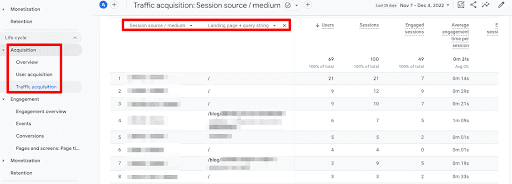
Thankfully, Google has started to roll out a separate Landing page report under Engagement but if you don’t see it yet then the best way is to go to the Acquisition → Traffic acquisition → Choose source / medium as primary dimension and add Landing page + query string in the secondary dimension. This is how it looks like:
We can go up a notch and add conversion rates as well to see which source is doing better than the others. Simply follow these steps:
Click on the pencil icon as shown above in the Pages and Screens (Engagement Reports) section
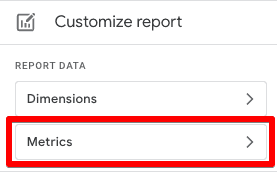
Click on Metrics under the customize report section on the right side
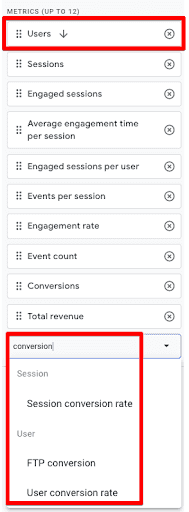
Search for conversion rate metrics and add the ones you want to based on the session or user. Remember, you can only have a total of 12 metrics in a standard report at the moment. You can also change the order of metrics by moving them around and default sort-by metric by clicking on it and the arrow icon will move to it. The below screenshot shows that ‘Users’ is the default sort-by metric in descending order.
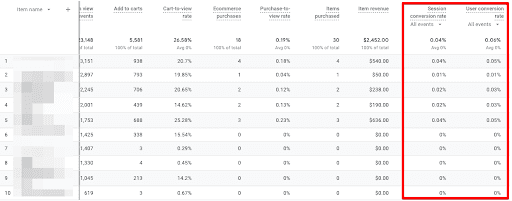
Finally, once you save the report you can see these metrics or any other changes that you’ve made in the final report. This applies to other reports as well and might be quite relevant for the Ecommerce purchases report under the Monetization tab.
E-commerce Purchases (Monetization Reports)
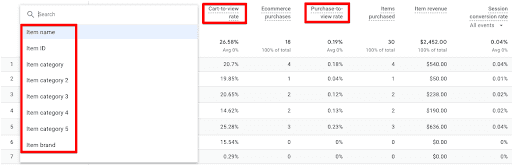
Knowing which items are doing better than others from add-to-cart to the final checkout/purchase step is very insightful.
Not only do you get to know what are the top performers that can be improved and make some quick gains, but you can also see how many people add the items to the cart or purchase it after viewing it (cart to view rate) and purchase to view rate and give you some good optimization opportunities if you take it to explorations.
Ads (Monetization & Acquisition Reports)
Relevance is an important factor when it comes to people landing on your website. For instance, if I see an ad for dog food and land on a website that is talking about dog grooming then I’ll bounce and restart my search.
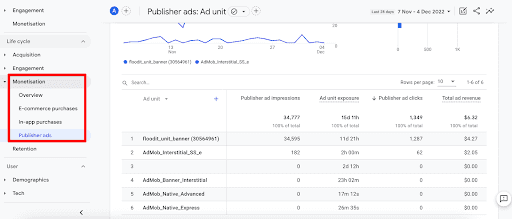
Therefore, what you talk about in the ads should be a story that is continued on the landing pages. Looking at Publisher Ads under Monetization reports would give you an idea about the Ads and clicks in your mobile app.
You can then investigate further the Ads, especially the copy and creatives to ensure they are relevant and help with your conversion rate (among other things, obviously).
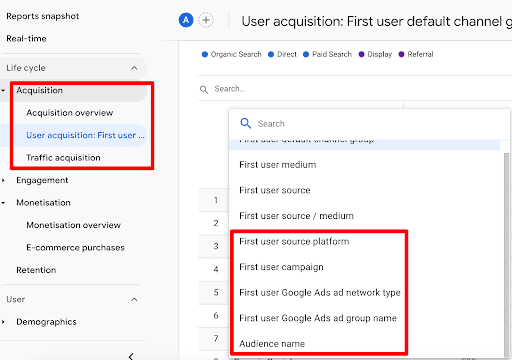
Whereas info related to Google Ads can also be seen in Acquisition reports as below. More on linking GA4 with Google Ads here.
User Behavior (Exploration Reports)
Who wouldn’t love to understand some good ol’ user behavior on the website to uncover which paths users take on your site as well as how they flow through a funnel? A CRO would definitely love it!
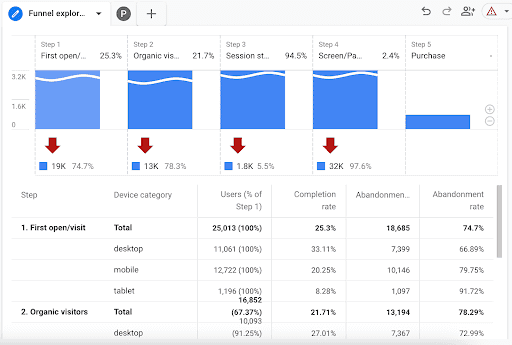
The Funnel Exploration report can help you understand how users are doing through different steps along with a tabular report below it and help you optimize the steps where you see very high drop-offs.
Path Exploration is another visualization of how users navigate through your website and it helps you raise questions like why are they not visiting a certain freshly designed beautiful page you had high hopes for?
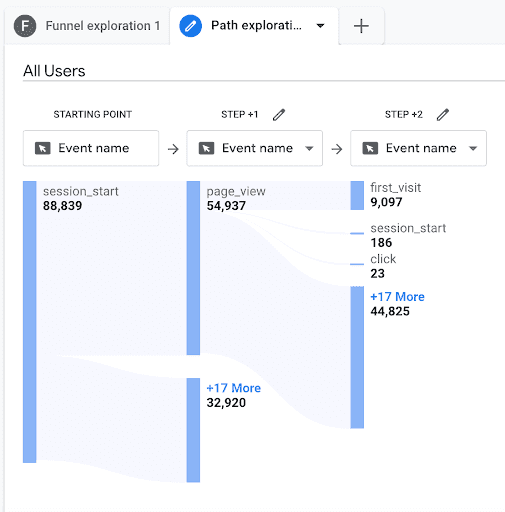
The results and visualizations of these reports would greatly vary depending upon how you set them up as well as the website’s structure but we can’t argue that these reports won’t help us to draw some solid insights.
Conclusion
With GA4 your data story doesn’t end, it simply keeps re-inventing itself and these reports are not the end all be all.
Other important reports like Retention (returning vs new users), Tech (device category performance, OS & Browsers), and Demographics (age and gender) can also come in handy to draw important insights.
And lastly, the GA4’s Explore section is an open sea for you to swim in any direction as long as you know your way home.
But don’t be hesitant if you find it’s too much, you will learn how to navigate these uncharted waters once you get into it as long as you keep trying or simply tell your boss to hire an analytics person!
Want to know what we're up to?
We'll send you an email when we publish new content