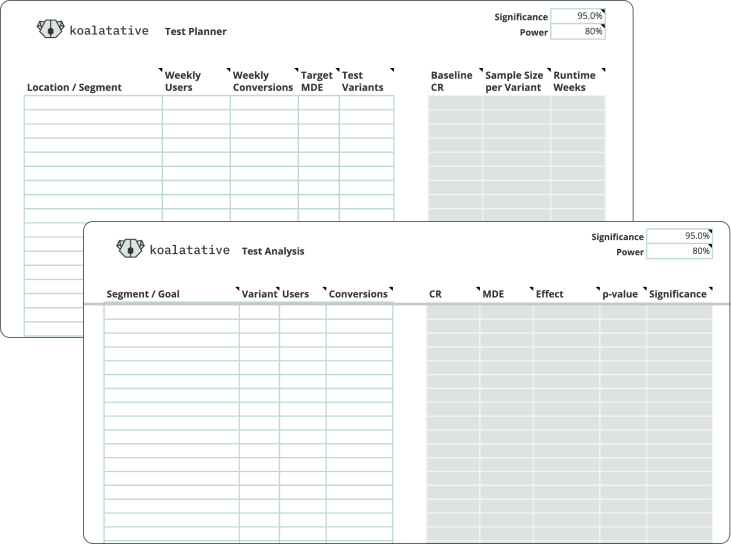
Test planning + test analysis templates
2 Google Sheets templates for pre- and post-analysis of AB tests

Who is this for?
All CROs and Experimenters running and analyzing AB tests who know that testing tool dashboards and free calculators are holding them back.

What problems do these templates solve?
Planning Template
1.
Knowing how long to run a test
Quick reference to see how many weeks you need to run an experiment on any particular page or content group.
2.
Understanding risk tradeoffs
Balancing false positive rate, false negative rate, and test duration, to find the best tradeoff for your business context.
3.
Deciding where to run experiments
Quickly see where you should focus your efforts and where it's not worth it, before you invest time and resources into mocking up test ideas.
Analysis Template
1.
Keep your data in one place
Once your test has ended, just enter the data once and it will be safe and sound in a Google Sheet where it's easy to share as is or integrate into a nicer report.
2.
Use transparent statistics
Instead of relying on a black box proprietary stats engine, you can use industry-standard statistics and have control over all the parameters.
3.
Calculate automatically
Once you enter your test data, all of the stats are calculated for you immediately so you can see the conversion rates, observed effects, and p-values of each segment and metric.
How is this better than free AB test and sample size calculators?
- They save you a ton of copying and pasting. Free calculators only let you do one calculation at a time, and then if you want to save the results you still need to copy and paste them somewhere else. With our templates you only need to enter the data once (which can easily be automated) and then all the calculations happen automatically in the same sheet.
- They give you transparency into and control over the stats that are being used. Every online test calculator and experimentation tool has a different set of assumptions and decisions that are made for you behind the scenes. Some testing tools even use data from other people's experiments to tell you whether your test is significant.
- They empower you to take a tool-agnostic approach to your test planning and analysis. Don't get locked into a particular tool by being reliant on their stats engine. Using these templates, you can switch to a new testing tool any time you want and your data won't change.
What's included?

A Google Sheet template for pre-test planning
A Google Sheet template for post-test analysis

A free version of both templates any time we update them
- A Google Sheets template for pre-test planning
- A Google Sheets template for post-test analysis
- A free version of both templates any time we update them


Good to know before you buy
- With a one-time purchase you’ll get lifetime access to these templates. When we make improvements and updates to them, anyone who has bought it who is still subscribed to our email list will automatically receive an email with the updated version.
- We’re offering the current price of $47 USD for the first 50 people who purchase, and we reserve the right to make any adjustments to the price of these products in the future.
- There are no refunds for this product. Once you get access and make a copy, there's no way for you to "return" it. But these templates will save you from so much copying and pasting that we're confident you'll be satisfied.
- A note about the statistics behind the templates: they use a frequentist, one-tailed, superiority test. You can still use them for two-tailed if you want by adjusting the significance or modifying the formula.
The analysis template calculates the significance in the direction of the observed effect. There are no adjustments in post-analysis to account for multiple variants, segments, or metrics.
The planning sheet increases the sample size in proportion to the number of variants, which is less conservative than a Bonferroni correction (ie faster runtime) and more conservative than Dunnett's. - If you have any questions about this tool or feedback you’d like to share with us, you can email us any time at mgmt@koalatative.com .
Ready to level up your processes?
get the templates for $47You'll get access immediately via email after purchase.